
JSE All Share Index Q3 2026 Review: an August rally, then a September sell-off
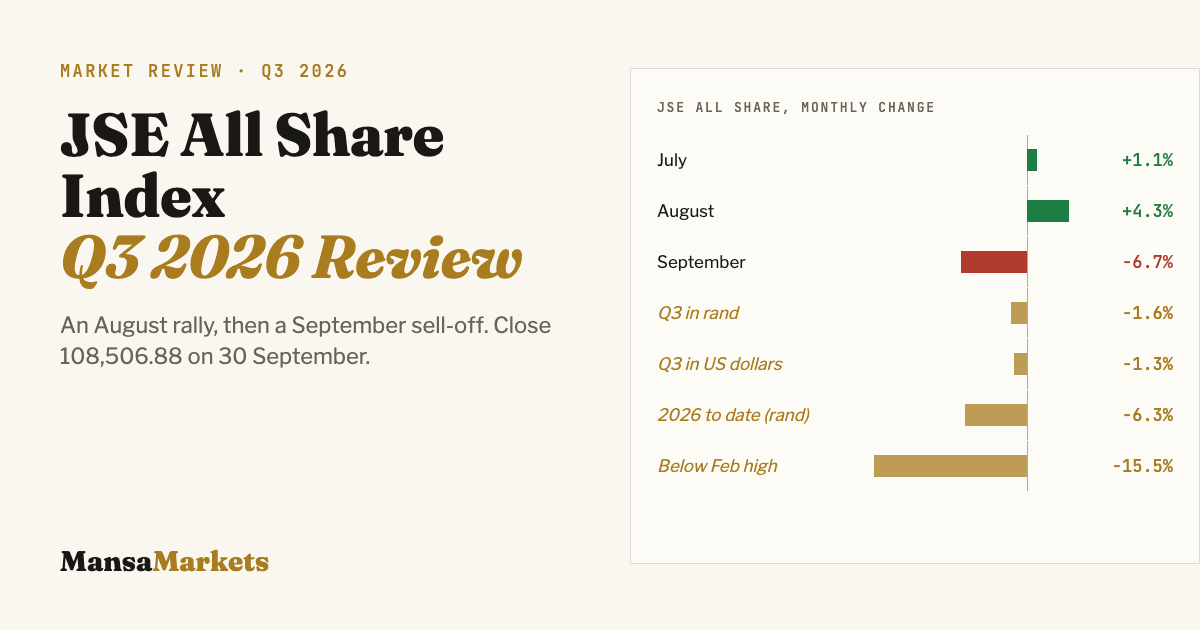
How the JSE All Share Index performed in Q3 2026: up 4.3% in August to 118,173, then down 6.7% in September to close the quarter at 108,506.88, 1.6% lower in rand and 15.5% below its February high. Month-end levels, rand and dollar returns.
What is the JSE All Share Index?
The FTSE/JSE All Share Index (ALSI, J203) is the broad benchmark for the Johannesburg Stock Exchange. It tracks the large and mid-sized companies on the exchange, weighted by the value of their freely traded shares, and covers almost all of the JSE's eligible market value. When people ask how "the JSE" did, this is usually the number they mean.
Q3 2026: a rally that didn't last
The JSE All Share Index edged up 1.1% in July, then rallied 4.3% in August to a quarter high of 118,173.40 on 28 August. September undid all of it. The index fell 6.7% in the month, its weakest month since March, and closed the quarter at 108,506.88, just above its quarter low of 108,335.05 from 23 July.
Over the full quarter the index lost 1.6% in rand. The rand firmed slightly against the dollar, so the loss for dollar investors was a little smaller, at 1.3%.
Still well below February's high
The index's highest close of 2026 so far is 128,455.68, on 27 February. At the end of September it was 15.5% below that peak and 6.3% below where it started the year. In dollars, the year-to-date loss is 5.1%, as a stronger rand softened the fall.
That makes South Africa one of the weaker African markets of 2026. While several of the continent's smaller exchanges, from Tanzania and Uganda to West Africa's BRVM, are up 40% or more in dollars this year, the JSE, Africa's largest exchange, has gone backwards.
JSE All-Share Index: month by month
| Month end | Close | Change |
|---|---|---|
| 30 Jun 2026 | 110,313.85 | start of Q3 |
| 31 Jul 2026 | 111,493.10 | +1.1% |
| 31 Aug 2026 | 116,257.30 | +4.3% |
| 30 Sep 2026 | 108,506.88 | −6.7% |
Quarter high: 118,173.40 on 28 Aug. Quarter low: 108,335.05 on 23 Jul.
How South Africa compares
In US dollars, South Africa's −1.3% ranked #10 of the 15 African markets in our African Markets Q3 2026 Review. The S&P 500 returned +2.0% over the same period and the MSCI Emerging Markets benchmark −2.4%.
Frequently asked questions
What is the JSE All Share Index?
The FTSE/JSE All Share Index (ALSI, ticker J203) tracks the large and mid-sized companies listed on the Johannesburg Stock Exchange, weighted by free-float market value. It covers roughly 99% of the JSE's eligible market capitalisation and is the main gauge of South African share prices.
How did the JSE All Share Index perform in Q3 2026?
The JSE All Share Index fell 1.6% in Q3 2026, from 110,313.85 on 30 June to 108,506.88 on 30 September. It rose 4.3% in August to a quarter high of 118,173.40 on 28 August, then fell 6.7% in September. In US dollars the quarter's return was −1.3%.
What was the JSE All Share Index high in 2026?
The index's 2026 closing high so far is 128,455.68 on 27 February. At the end of Q3 it was 15.5% below that level and 6.3% below where it started the year in rand.
What is the difference between the JSE All Share and the JSE Top 40?
The Top 40 covers only the 40 largest JSE companies by market value, while the All Share also includes mid-sized companies. Because the largest companies dominate both, the two indices usually move closely together.