
African Markets Q3 2026 Review: the small exchanges took the quarter
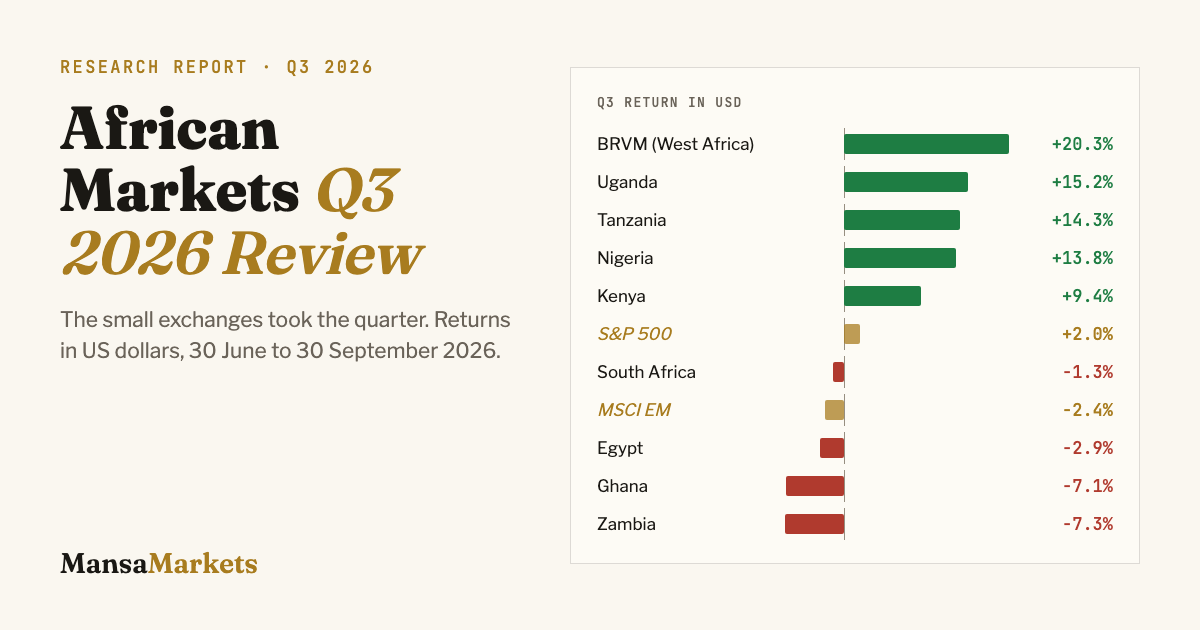
West Africa's BRVM, Uganda and Tanzania each returned more than 14% in dollars between July and September, while Johannesburg, Cairo and Casablanca went backwards for dollar investors. 7 of the 15 African markets with a clean dollar conversion beat the S&P 500's +2%.
A quarter for the frontier
In the first half of 2026, eleven of the sixteen exchanges in this review rose in local currency (see our H1 2026 review). The third quarter narrowed the rally. The biggest gains moved to the continent's smaller and less liquid markets, and the large, internationally traded exchanges either stalled or slipped.
The BRVM Composite, which covers eight CFA franc economies from Côte d'Ivoire to Senegal, rose 21.0% to 548.38 and kept almost all of it in dollars because the franc is tied to the euro. Uganda's All-Share Index gained 23.2%, the largest local move of the quarter, although a 7% slide in the shilling cut the dollar return to 15.2%. Tanzania's DSE All-Share Index added 15.0%, extending a year in which it has risen 68.5%.
At the other end, Ghana gave back 4.0% after leading the first half, Malawi fell another 6.4%, and Morocco's MASI dropped 2.7% to sit 5.9% below where it started the year.
Q3 2026 returns in US dollars
Currencies decided the dollar scoreboard
For a dollar-based investor, the exchange rate mattered as much as the index in Q3. The naira was the standout: it firmed about 3.7% against the dollar, lifting Nigeria's 9.5% local gain to 13.8% in dollars. Few other currencies helped.
Zambia is the clearest example of the reverse. The LuSE All-Share Index finished the quarter almost exactly where it began, up 0.03% in kwacha, but the kwacha lost close to 8% against the dollar and the dollar return came out at −7.3%. Egypt's EGX 30 rose 2.8% in pounds and still lost 2.9% in dollars as the pound eased past 52 per dollar. Ghana's 4.0% fall became a 7.1% loss once the cedi's slide is counted.
Nigeria: the heavyweight that kept going
Nigeria is now the year's best-performing major African market for dollar investors, up 76.2% since 31 December. The NGX All-Share Index added 9.5% in the quarter to close at 251,211.67, after touching a record 252,566.84 on 28 September.
The gains were concentrated. Airtel Africa, Seplat Energy, MTN Nigeria, Dangote Cement and First HoldCo did most of the lifting, and First HoldCo nearly tripled ahead of its entry into FTSE Russell's Frontier 50 index on 21 September alongside Zenith Bank, GTCO, MTN Nigeria, Dangote Cement and Aradel. Seplat reached an all-time high of ₦16,000 a share in late September. Breadth was weaker than the index suggests: more Nigerian stocks fell in the quarter than rose. For the stock-by-stock detail, see Kobo Terminal's NGX Q3 2026 review.
East Africa's quiet strength
Kenya's NSE All-Share Index (NASI) rose 9.6% with a steady shilling, giving a 9.4% dollar return and a year-to-date gain of 31.1% in dollars. Rwanda added 3.1%. Together with Uganda and Tanzania, the East African exchanges are among the few places in the world where 2026 returns have run well ahead of both US and emerging-market benchmarks.
The large markets stood still
South Africa's JSE All-Share Index slipped 1.6% and is down 6.3% for the year in rand. Mauritius, Botswana and Namibia moved less than 2.5% in either direction. Egypt and Morocco, the two other large North African markets in this review, both lost ground in dollars. For investors who measure Africa by its biggest exchanges, Q3 looked like a flat quarter. The returns were elsewhere.
Full table: all 16 markets
| # | Market | Index | 30 Jun 2026 | 30 Sep 2026 | Q3 local | Q3 USD | YTD USD |
|---|---|---|---|---|---|---|---|
| 1 | 🌍 West Africa (WAEMU) | BRVM Composite Index | 453.21 | 548.38 | +21.0% | +20.3% | +53.1% |
| 2 | 🇺🇬 Uganda | USE All-Share Index | 2,063.98 | 2,543.14 | +23.2% | +15.2% | +43.9% |
| 3 | 🇹🇿 Tanzania | DSE All-Share Index | 4,048.80 | 4,654.42 | +15.0% | +14.3% | +57.1% |
| 4 | 🇳🇬 Nigeria | NGX All-Share Index | 229,419.18 | 251,211.67 | +9.5% | +13.8% | +76.2% |
| 5 | 🇰🇪 Kenya | NSE All-Share Index (NASI) | 224.15 | 245.60 | +9.6% | +9.4% | +31.1% |
| 6 | 🇷🇼 Rwanda | RSE All-Share Index | 255.05 | 262.85 | +3.1% | +2.4% | +42.2% |
| 7 | 🇳🇦 Namibia | NSX Overall Index | 2,312.29 | 2,354.28 | +1.8% | +2.2% | +11.3% |
| 8 | 🇲🇺 Mauritius | SEM-ASI (All-Share) | 2,031.69 | 2,072.72 | +2.0% | +0.8% | −5.7% |
| 9 | 🇧🇼 Botswana | BSE Domestic Company Index | 11,157.56 | 11,249.74 | +0.8% | +0.2% | +2.9% |
| 10 | 🇿🇦 South Africa | JSE All-Share Index | 110,313.85 | 108,506.88 | −1.6% | −1.3% | −5.1% |
| 11 | 🇪🇬 Egypt | EGX 30 | 50,487.96 | 51,894.83 | +2.8% | −2.9% | +13.6% |
| 12 | 🇲🇦 Morocco | MASI | 18,217.27 | 17,733.06 | −2.7% | −5.7% | −11.4% |
| 13 | 🇲🇼 Malawi | MSE All-Share Index | 524,002.31 | 490,269.10 | −6.4% | −6.6% | −18.1% |
| 14 | 🇬🇭 Ghana | GSE Composite Index | 14,724.26 | 14,141.56 | −4.0% | −7.1% | +44.9% |
| 15 | 🇿🇲 Zambia | LuSE All-Share Index | 25,784.88 | 25,792.68 | 0.0% | −7.3% | +12.8% |
| 16 | 🇿🇼 Zimbabwe | ZSE All-Share Index | 417.81 | 472.15 | +13.0% | n/a | n/a |
YTD runs from 31 December 2025. USD returns combine the index move with the change in the currency against the dollar.
🌍 West Africa (WAEMU): The CFA franc is pegged to the euro, so BRVM gains carry into dollars almost intact.
🇳🇬 Nigeria: Record close of 252,566.84 on 28 September. The naira firmed about 3.7% against the dollar in the quarter.
🇧🇼 Botswana: Last close 29 September; 30 September was a public holiday.
🇪🇬 Egypt: Up in pounds, down in dollars as the pound eased past 52 per dollar.
🇿🇲 Zambia: Flat in kwacha (+0.03%), but the kwacha lost close to 8% against the dollar.
🇿🇼 Zimbabwe: Reported in ZiG (ZWG). No clean, continuously quoted USD rate is available, so no USD return is shown.
What to watch in Q4
Three things will shape the final quarter. First, whether the frontier rally can absorb profit-taking after gains of 50% to 70% year to date in Tanzania, the BRVM, Uganda and Zimbabwe. Second, currency direction: the naira's strength has been worth several points of return to dollar investors in Nigeria, while further weakness in the kwacha, cedi or Egyptian pound would keep eroding returns there. Third, foreign flows into Nigeria after the FTSE Russell changes took effect on 21 September.