
Africa's Strongest Currencies of 2026: Zambia's kwacha leads
Zambia's kwacha was Africa's strongest currency of 2026, up 8.3% against the US dollar. Nigeria's naira (+7.4%) and the Liberian dollar (+5.2%) came second and third. Only 6 of the 24 ranked currencies gained on the dollar this year.
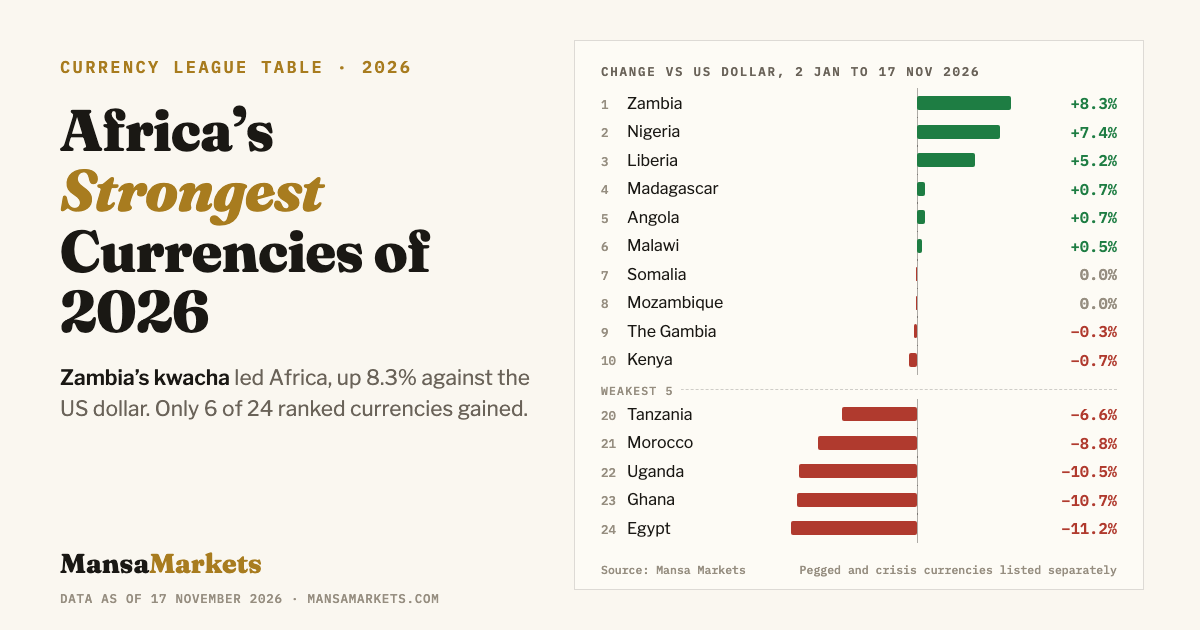
The top 10
Zambia's kwacha firmed from 22.2509 per dollar on 2 January to 20.5372 on 17 November. Nigeria's naira went from 1,445.05 to 1,345.93, and the Liberian dollar from 178.43 to 169.66. Below the top three, the gains are small: most of the continent's currencies held roughly steady or slipped, while the dollar gained about 7% on the euro over the same period.
The weakest 5
Five ranked currencies lost more than 6% against the dollar: Egypt's pound (−11.2%), Ghana's cedi (−10.7%), Uganda's shilling (−10.5%), Morocco's dirham (−8.8%) and Tanzania's shilling (−6.6%). Currencies that went through a crisis or a one-step devaluation are listed separately below so that they do not distort this table.
Best in each region
The most stable currencies
Stability is the annualised volatility of daily moves against the dollar: the lower, the steadier. Several of the steadiest official rates are closely managed by their central banks, which is noted in the full table.
| # | Country | Currency | Volatility | Change vs USD |
|---|---|---|---|---|
| 1 | 🇲🇿 Mozambique | Mozambican metical | 1.5% | 0.0% |
| 2 | 🇬🇳 Guinea | Guinean franc | 2.4% | −1.0% |
| 3 | 🇦🇴 Angola | Angolan kwanza | 3.1% | +0.7% |
| 4 | 🇩🇿 Algeria | Algerian dinar | 3.2% | −5.4% |
| 5 | 🇰🇪 Kenya | Kenyan shilling | 3.4% | −0.7% |
Full ranking: 24 currencies
| # | Country | Currency | Per USD, 2 Jan | Per USD, 17 Nov | Change vs USD | In region | Volatility |
|---|---|---|---|---|---|---|---|
| 1 | 🇿🇲 Zambia | Zambian kwacha (ZMW) | 22.2509 | 20.5372 | +8.3% | #1 Southern | 13.9% |
| 2 | 🇳🇬 Nigeria | Nigerian naira (NGN) | 1,445.05 | 1,345.93 | +7.4% | #1 West | 5.6% |
| 3 | 🇱🇷 Liberia | Liberian dollar (LRD) | 178.43 | 169.66 | +5.2% | #2 West | 7.1% |
| 4 | 🇲🇬 Madagascar | Malagasy ariary (MGA) | 4,591.21 | 4,559.00 | +0.7% | #1 East | 8.6% |
| 5 | 🇦🇴 Angola | Angolan kwanza (AOA) | 921.18 | 915.07 | +0.7% | #2 Southern | 3.1% |
| 6 | 🇲🇼 Malawi * | Malawian kwacha (MWK) | 1,734.71 | 1,726.52 | +0.5% | #3 Southern | 4.2% |
| 7 | 🇸🇴 Somalia | Somali shilling (SOS) | 569.24 | 569.46 | 0.0% | #2 East | 4.7% |
| 8 | 🇲🇿 Mozambique * | Mozambican metical (MZN) | 63.8521 | 63.8791 | 0.0% | #4 Southern | 1.5% |
| 9 | 🇬🇲 The Gambia | Gambian dalasi (GMD) | 73.9607 | 74.1570 | −0.3% | #3 West | 6.5% |
| 10 | 🇰🇪 Kenya | Kenyan shilling (KES) | 129.02 | 129.98 | −0.7% | #3 East | 3.4% |
| 11 | 🇬🇳 Guinea | Guinean franc (GNF) | 8,756.12 | 8,847.21 | −1.0% | #4 West | 2.4% |
| 12 | 🇷🇼 Rwanda | Rwandan franc (RWF) | 1,456.31 | 1,474.31 | −1.2% | #4 East | 3.7% |
| 13 | 🇧🇮 Burundi * | Burundian franc (BIF) | 2,961.50 | 3,006.73 | −1.5% | #1 Central | 4.6% |
| 14 | 🇲🇷 Mauritania | Mauritanian ouguiya (MRU) | 39.8427 | 40.5000 | −1.6% | #1 North | 5.4% |
| 15 | 🇿🇦 South Africa | South African rand (ZAR) | 16.5438 | 16.9621 | −2.5% | #5 Southern | 12.1% |
| 16 | 🇿🇼 Zimbabwe * | Zimbabwe Gold (ZiG) (ZWG) | 25.9862 | 26.7065 | −2.7% | #6 Southern | 5.2% |
| 17 | 🇲🇺 Mauritius | Mauritian rupee (MUR) | 46.1869 | 47.7975 | −3.4% | #5 East | 7.0% |
| 18 | 🇹🇳 Tunisia | Tunisian dinar (TND) | 2.8835 | 3.0390 | −5.1% | #2 North | 8.7% |
| 19 | 🇩🇿 Algeria | Algerian dinar (DZD) | 129.51 | 136.98 | −5.4% | #3 North | 3.2% |
| 20 | 🇹🇿 Tanzania | Tanzanian shilling (TZS) | 2,469.64 | 2,644.99 | −6.6% | #6 East | 4.3% |
| 21 | 🇲🇦 Morocco | Moroccan dirham (MAD) | 9.1107 | 9.9904 | −8.8% | #4 North | 5.2% |
| 22 | 🇺🇬 Uganda | Ugandan shilling (UGX) | 3,620.04 | 4,046.18 | −10.5% | #7 East | 10.9% |
| 23 | 🇬🇭 Ghana | Ghanaian cedi (GHS) | 10.4646 | 11.7200 | −10.7% | #5 West | 8.4% |
| 24 | 🇪🇬 Egypt | Egyptian pound (EGP) | 47.6627 | 53.6812 | −11.2% | #5 North | 11.6% |
* 🇲🇼 Malawi: Official rate is tightly managed by the central bank.
* 🇲🇿 Mozambique: Official rate is tightly managed by the central bank.
* 🇧🇮 Burundi: Official rate is tightly managed by the central bank.
* 🇿🇼 Zimbabwe: Official rate is tightly managed by the central bank. Checked against one rate series only.
Pegged currencies
These currencies are fixed to the euro, the rand or the dollar, so their move against the dollar is set by the anchor currency rather than by their own economies. The CFA francs and other euro-linked currencies fell about 6.4% because the euro weakened against the dollar over the period. They are listed here rather than in the ranking.
| Country | Currency | Peg | Change vs USD |
|---|---|---|---|
| 🇪🇷 Eritrea | Eritrean nakfa (ERN) | Fixed to the US dollar (15 per dollar) | 0.0% |
| 🇩🇯 Djibouti | Djiboutian franc (DJF) | Fixed to the US dollar (177.72 per dollar) | −0.1% |
| 🇱🇸 Lesotho | Lesotho loti (LSL) | Fixed one-to-one to the South African rand | −2.5% |
| 🇳🇦 Namibia | Namibian dollar (NAD) | Fixed one-to-one to the South African rand | −2.5% |
| 🇸🇿 Eswatini | Eswatini lilangeni (SZL) | Fixed one-to-one to the South African rand | −2.5% |
| 🇨🇻 Cape Verde | Cape Verdean escudo (CVE) | Fixed to the euro (110.265 per euro) | −6.4% |
| 🌍 West Africa (8 WAEMU countries) | West African CFA franc (XOF) | Fixed to the euro (655.957 per euro) | −6.4% |
| 🌍 Central Africa (6 CEMAC countries) | Central African CFA franc (XAF) | Fixed to the euro (655.957 per euro) | −6.4% |
| 🇰🇲 Comoros | Comorian franc (KMF) | Fixed to the euro (491.968 per euro) | −6.4% |
| 🇸🇹 São Tomé and Príncipe | São Tomé and Príncipe dobra (STN) | Fixed to the euro (24.5 per euro) | −6.5% |
Crises and one-step adjustments
Ranked separately so that a single extreme move does not distort the main table.
| Country | Currency | Why it is listed separately | Change vs USD |
|---|---|---|---|
| 🇸🇩 Sudan | Sudanese pound (SDG) | The official rate barely moved while Sudan's war continued; it does not reflect what dollars cost in the market. | +0.1% |
| 🇱🇾 Libya | Libyan dinar (LYD) | Includes a one-step official adjustment of about 13% on 22 January 2026. | −16.0% |
| 🇸🇸 South Sudan | South Sudanese pound (SSP) | Fell sharply through the year amid South Sudan's economic crisis. | −23.5% |
Not ranked this year
For Botswana, DR Congo, Ethiopia, Seychelles and Sierra Leone, the daily rates we checked disagree too much, or swing back and forth too often, to give one reliable figure. We would rather leave a currency out than publish a number we cannot stand behind. We will add them as soon as their rates can be confirmed.
Lines for the press
Free to quote word for word, with attribution to Mansa Markets.
- “Zambia's kwacha was Africa's strongest currency in 2026, up 8.3% against the US dollar, according to Mansa Markets.”
- “Nigeria's naira was Africa's second-strongest currency in 2026, up 7.4% against the US dollar, according to Mansa Markets.”
- “The Liberian dollar was Africa's third-strongest currency in 2026, up 5.2% against the US dollar, according to Mansa Markets.”
- “Mauritania's ouguiya was the best-performing currency in North Africa in 2026, down 1.6% against the US dollar, according to Mansa Markets.”
- “Burundi's franc was the best-performing currency in Central Africa in 2026, down 1.5% against the US dollar, according to Mansa Markets.”
- “Madagascar's ariary was the strongest currency in East Africa in 2026, up 0.7% against the US dollar, according to Mansa Markets.”
- “Nigeria's naira was the strongest currency in West Africa in 2026, up 7.4% against the US dollar, according to Mansa Markets.”
- “Zambia's kwacha was the strongest currency in Southern Africa in 2026, up 8.3% against the US dollar, according to Mansa Markets.”
- “Mozambique's metical was Africa's most stable currency against the US dollar in 2026, according to Mansa Markets.”
Methodology
What is measured. The change in each currency against the US dollar from the close of 2 January 2026, the first trading day of the year, to the close of 17 November 2026. Rates are official or interbank reference mid-rates in local currency per dollar, the same rate type for every currency. A currency that buys more dollars at the end than at the start shows a gain.
How each figure is checked. Every currency is compared across independent daily rate series. The 17 November rate is the middle value of up to three sources, including Mansa Markets' own collection of central bank rates. A currency is ranked only if at least two sources agree within 1.5% and its daily series is free of repeated reversals that point to bad data.
What is listed separately. Currencies pegged to the euro, the rand or the dollar; currencies in crisis or with a one-step official devaluation during the year; and currencies whose rates could not be confirmed. Regions follow the African Union's five regions. Volatility is the annualised standard deviation of daily changes since 2 January.
What it does not show. Official rates. Where a parallel market exists, what a dollar actually costs can differ; see the Mansa Markets Stablecoin Premium Index for the gap in 24 currencies.
Mansa Markets (2026). Africa's Strongest Currencies of 2026. Data as of 17 November 2026. https://www.mansamarkets.com/reports/africas-strongest-currencies-2026For the underlying data or comment, contact us via mansamarkets.com/contact. More research: African Markets Q3 2026 Review.