
Africa's Best-Performing Stock Markets of 2026: Nigeria leads in dollars
Nigeria's stock market was Africa's best performer of 2026 so far: the NGX All-Share Index is up 71.1% in US dollars. Tanzania's stock market (+48.1%) and Rwanda's stock market (+45.1%) are second and third. 8 of the 14 markets we rank in dollars beat the US S&P 500 (+4.8%) over the same period.
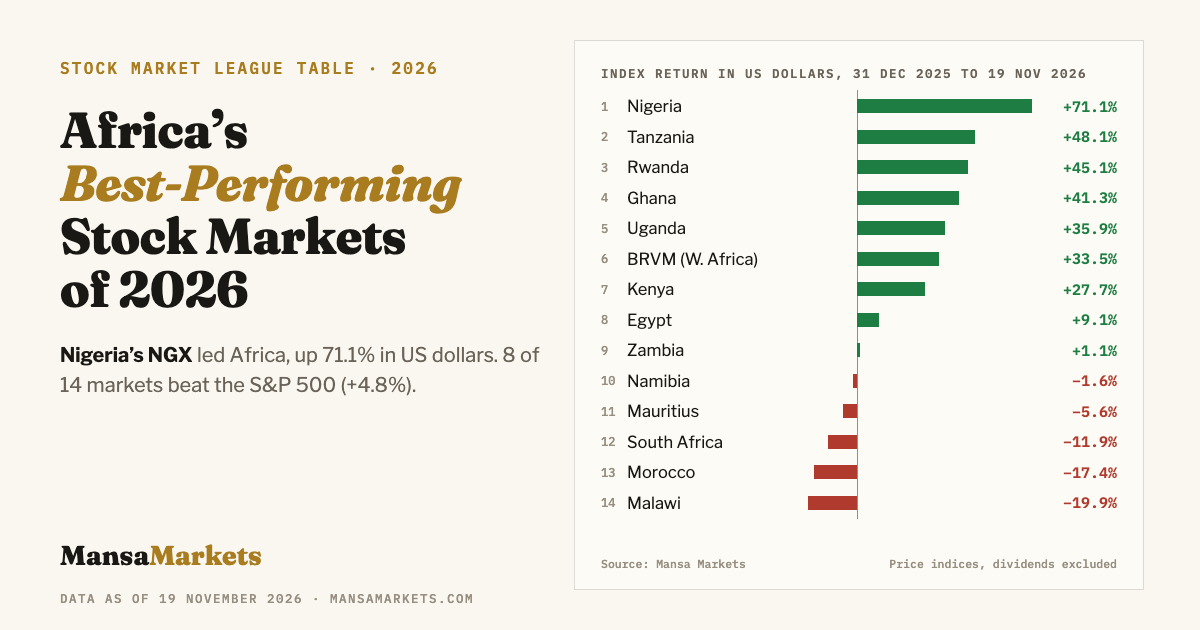
The ranking in US dollars
Ranking in dollars puts every market on the same footing: it is the return a foreign investor would have earned on the index, after converting back at the end. The NGX All-Share Index rose from 155,613.03 to 248,286.56 (+59.6% in naira), and the naira firmed 7.2% against the dollar on top. Tanzania, Rwanda, Ghana, Uganda and the BRVM all returned more than 30% in dollars. 9 of 14 markets are up in dollars; Malawi's stock market is last at −19.9%.
Best in each region
No Central African market is ranked: the BVMAC regional exchange is not covered.
How currencies changed the ranking
In local currency, the order is different. Ghana's index is up 58% in cedis, almost level with Nigeria, but the cedi's fall cut its dollar return to 41%. Zambia's index is down 6.4% in kwacha, yet the kwacha's 8% rise against the dollar left foreign investors slightly ahead. Egypt's EGX 30 gained 23% in pounds but only 9% in dollars. The five biggest currency effects:
| Market | In local currency | Currency vs USD | In US dollars |
|---|---|---|---|
| 🇺🇬 Uganda | +53.6% | −11.6% | +35.9% |
| 🇬🇭 Ghana | +58.4% | −10.8% | +41.3% |
| 🇪🇬 Egypt | +23.0% | −11.3% | +9.1% |
| 🇳🇬 Nigeria | +59.6% | +7.2% | +71.1% |
| 🇹🇿 Tanzania | +59.4% | −7.1% | +48.1% |
Full ranking: 14 stock markets
| # | Market | Index | 31 Dec 2025 | 19 Nov 2026 | Local currency | Currency vs USD | US dollars | In region |
|---|---|---|---|---|---|---|---|---|
| 1 | 🇳🇬 Nigeria * | NGX All-Share Index | 155,613.03 | 248,286.56 | +59.6% | +7.2% (NGN) | +71.1% | #1 West |
| 2 | 🇹🇿 Tanzania | DSE All-Share Index | 2,761.93 | 4,403.30 | +59.4% | −7.1% (TZS) | +48.1% | #1 East |
| 3 | 🇷🇼 Rwanda | RSE All-Share Index | 182.26 | 268.88 | +47.5% | −1.6% (RWF) | +45.1% | #2 East |
| 4 | 🇬🇭 Ghana * | GSE Composite Index | 8,770.25 | 13,892.13 | +58.4% | −10.8% (GHS) | +41.3% | #2 West |
| 5 | 🇺🇬 Uganda | USE All-Share Index | 1,631.80 | 2,507.03 | +53.6% | −11.6% (UGX) | +35.9% | #3 East |
| 6 | 🌍 BRVM (West Africa) * | BRVM Composite Index | 345.75 | 493.95 | +42.9% | −6.5% (XOF) | +33.5% | #3 West |
| 7 | 🇰🇪 Kenya | NSE All-Share Index (NASI) | 186.58 | 239.68 | +28.5% | −0.6% (KES) | +27.7% | #4 East |
| 8 | 🇪🇬 Egypt * | EGX 30 | 41,828.97 | 51,458.00 | +23.0% | −11.3% (EGP) | +9.1% | #1 North |
| 9 | 🇿🇲 Zambia * | LuSE All-Share Index | 25,919.83 | 24,269.23 | −6.4% | +8.0% (ZMW) | +1.1% | #1 Southern |
| 10 | 🇳🇦 Namibia * | NSX Overall Index | 2,141.33 | 2,193.21 | +2.4% | −3.9% (NAD) | −1.6% | #2 Southern |
| 11 | 🇲🇺 Mauritius | SEM All-Share Index (SEMDEX) | 2,118.85 | 2,034.37 | −4.0% | −1.7% (MUR) | −5.6% | #5 East |
| 12 | 🇿🇦 South Africa * | JSE All Share Index | 115,832.28 | 106,216.49 | −8.3% | −3.9% (ZAR) | −11.9% | #3 Southern |
| 13 | 🇲🇦 Morocco | MASI | 18,846.35 | 16,997.89 | −9.8% | −8.5% (MAD) | −17.4% | #2 North |
| 14 | 🇲🇼 Malawi | MSE All-Share Index | 598,062.80 | 478,423.67 | −20.0% | +0.2% (MWK) | −19.9% | #4 Southern |
* 🇳🇬 Nigeria: Closed at a record 254,762.81 on 4 November. The naira firmed about 7% against the dollar, adding to the gain.
* 🇬🇭 Ghana: Up 58% in cedis; the cedi's fall against the dollar trimmed the dollar return to 41%.
* 🌍 BRVM (West Africa): Serves eight CFA-franc countries: Benin, Burkina Faso, Côte d'Ivoire, Guinea-Bissau, Mali, Niger, Senegal and Togo. Peaked above 555 in mid-September.
* 🇪🇬 Egypt: Up 23% in pounds; the pound's slide past 53 per dollar cut the dollar return to 9%.
* 🇿🇲 Zambia: Down 6.4% in kwacha, but the kwacha's 8% gain against the dollar turned it positive in dollars.
* 🇳🇦 Namibia: The Overall Index includes JSE-listed companies that also trade in Windhoek.
* 🇿🇦 South Africa: Fell 3.7% on 18 November alone as the rand slid to its weakest level of the year.
Shown in local currency only
| Market | Index | 31 Dec 2025 | 19 Nov 2026 | Local currency | Why no dollar return |
|---|---|---|---|---|---|
| 🇿🇼 Zimbabwe | ZSE All-Share Index | 277.86 | 491.81 | +77.0% (ZWG) | Shown in ZiG (ZWG) only: there is no clean, continuously quoted dollar rate for the ZiG, so no dollar return is given. |
| 🇧🇼 Botswana | BSE Domestic Company Index | 11,030.03 | 11,354.94 | +2.9% (BWP) | Shown in pula only: published dollar rates for the pula on 31 December 2025 disagree too much (13.1 to 14.0 per dollar) to give one reliable dollar return. |
Not covered: Tunisia, Eswatini and Central Africa's BVMAC.
Against global benchmarks
Over the same dates, in dollars: the S&P 500 (US) +4.8% and the MSCI Emerging Markets +3.7%. 8 of the 14 African markets ranked here did better than the S&P 500, and 8 beat the MSCI Emerging Markets index.
Lines for the press
Free to quote word for word, with attribution to Mansa Markets.
- “Nigeria's stock market was Africa's best-performing stock market of 2026 in US dollar terms, with the NGX All-Share Index up 71.1% in dollars to 19 November 2026, according to Mansa Markets.”
- “Tanzania's stock market was Africa's second-best-performing stock market of 2026 in US dollar terms, with the DSE All-Share Index up 48.1% in dollars to 19 November 2026, according to Mansa Markets.”
- “Rwanda's stock market was Africa's third-best-performing stock market of 2026 in US dollar terms, with the RSE All-Share Index up 45.1% in dollars to 19 November 2026, according to Mansa Markets.”
- “Egypt's stock market was the best-performing stock market in North Africa in 2026, up 9.1% in US dollar terms, according to Mansa Markets.”
- “Zambia's stock market was the best-performing stock market in Southern Africa in 2026, up 1.1% in US dollar terms, according to Mansa Markets.”
- “8 of 14 African stock markets beat the S&P 500 in US dollar terms in 2026, led by Nigeria (+71.1%), according to Mansa Markets.”
Methodology
What is measured. The change in each exchange's main all-share or benchmark index from its last close of 2025 (31 December) to its close on 19 November 2026. These are price indices, so dividends are not included. The dollar return converts both index levels at the exchange rate of the same day.
How each figure is checked. Index levels come from Mansa Markets' daily index history and match our verified Q3 2026 review at the end of September; the latest closes were checked against published market reports. The 31 December exchange rate is a daily reference mid-rate checked against a second series. The 19 November rate is the middle value of up to three sources, including Mansa Markets' own collection of central bank rates. Known bad prints are excluded.
What is listed separately. Markets whose dollar rate cannot be confirmed are shown in local currency only. Regions follow the grouping used in our currency league table.
What it does not show. Official rates. Where a parallel market exists, what a dollar actually costs can differ; see the Mansa Markets Stablecoin Premium Index.
Mansa Markets (2026). Africa's Best-Performing Stock Markets of 2026. Data as of 19 November 2026. https://www.mansamarkets.com/reports/africas-best-performing-stock-markets-2026For the underlying data or comment, contact us via mansamarkets.com/contact. More research: Africa's Strongest Currencies of 2026 · African Markets Q3 2026 Review.